When we started Estad, we knew our biggest challenge wouldn’t be building the UI or launching fast. It would be cleaning up the raw data we scrape from the internet. Messy data wasn’t just likely… it was guaranteed.
If we wanted to serve accurate, trustworthy information to users, we had to define a clear workflow: how data is collected, validated, normalized, and ultimately delivered to the product. Without that structure, we’d constantly be fighting inconsistencies: missing fields, duplicated listings, wrong locations, outdated prices, and formatting that changes from site to site.
So we built a process that treats scraping as only the first step. From there, every record goes through cleanup rules, sanity checks, and enrichment, so what reaches the user is consistent and reliable. That way, even when the source websites are chaotic, Estad can stay predictable.
Data Collection
Estad uses web scraping to gather up-to-date listings from multiple real estate websites, ensuring compliance with each site’s terms of service and robots.txt. The data is continuously updated to reflect the latest market trends.
Data Cleaning and Standardization
Estad subsequently cleans and standardizes scraped data by addressing inconsistencies, such as missing values and outliers, and ensuring uniformity in key metrics like prices, lease tenure, land size, and building size.
By default, prices are expressed in EUR. Currency conversion is done via Fixer’s API which can create slight differences between the prices displayed on Estad and prices shown on the original listing sites.
Removing and Filtering Bad Data
To ensure the integrity of our analysis, Estad features a series of checks to detect and flag potential errors. This includes reviewing values that fall outside of expected ranges and cross-referencing units of measurement. Incorrect or inconsistent data is corrected if possible and removed otherwise.
In addition to these checks, several filtering criteria are applied to ensure that only reliable data is considered in Estad’s calculations and any computed values are not distorted. The following conditions must be met for a data point to be included:
- Price > 30,000 EUR: any listings with a price less than this number is excluded, as these are likely errors, placeholders, or a rental property mislabeled as a leasehold.
- Land Size (sqm) and Building Size > 0: Properties with a land AND building sizes equal to 0 are filtered out to avoid including incorrect or non-standard properties.
- Land Size (sqm) < 10,000: properties with land sizes greater than 30,000 square meters are excluded to avoid distorting the analysis with unusually large estates or commercial developments.
- Building Size is more than 10% of the Land Size: properties with building sizes less than 10% of the land size are excluded, as this kind of data is likely to be inaccurate and a data entry error. We see this a lot when an apartment is published with a land size including the entire plot of the complex.
- Price (EUR) < 50,000,000: Listings with prices above 50 million Euros are excluded, as they typically represent niche markets that are not reflective of general trends, or because they could be inaccurate data.
- Ownership Tenure (years) < 100 and > 5: For properties with lease tenures outside the range of 5 to 100 years, the tenure is replaced with the median tenure value instead of excluding the data. This ensures that leasehold properties are represented more consistently across our analysis.
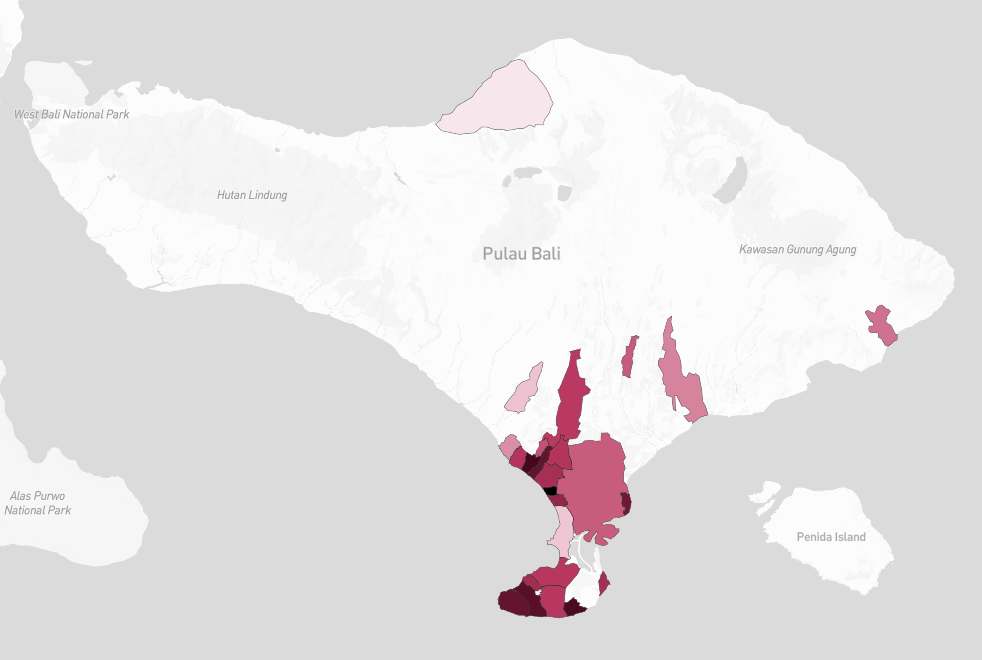
Mapping Listings to Regions
After cleaning and filtering the data, the next step in our process is to accurately map each property listing to a specific region in Bali. This step is crucial for providing localized insights into real estate prices across different areas of the island.
Bali is known for its diverse regions, each with its own unique characteristics and market trends. To ensure that our map accurately reflects these variations, each property listing is assigned to a predefined set of regions based on its location data.
This allows Estad to offer a more detailed analysis of real estate prices on a regional level. Users can easily compare how prices vary between popular areas like Seminyak, Ubud, or Canggu, and gain a better understanding of the market dynamics in each region. This regional mapping also enhances the usability of our interactive map, allowing users to zoom in on specific areas of interest and explore the data in a more meaningful way.
Handling Missing or Invalid Data
In the collected real estate data, it’s not uncommon to encounter listings with missing or invalid building sizes or tenure information. Excluding these data points would significantly reduce the dataset, as some websites either do not provide this information or lack the capacity to cross-check and verify it on their end. To address this, several methods are employed to estimate these missing values, ensuring that our analysis remains as comprehensive as possible.
For ownership tenure, if a property listing lacks this information or if the tenure provided is invalid, the median tenure is derived from the valid data points in our dataset. This median tenure is then used to estimate the tenure for listings without this data. By using the median, it is possible to ensure that the estimated value reflects the typical tenure period in the market, allowing us to maintain consistency across our analysis.
Similarly, when any listings are encountered with no or an invalid building size, the percentage of the building size is derived by referencing the land size of each valid data point and similarly replacing it with the median percentage value. This median percentage is applied to estimate the building size for properties that do not have this information. This approach helps to maintain the accuracy of our price per square meter calculations, even when specific data points are missing.
Calculating Price Per Square Meter
Once the data is cleaned, filtered, and standardized, the next critical step is to calculate the price per square meter for each property. This involves understanding how much square meterage is accounted for in each listing, which is essential for providing accurate and meaningful insights.
For each property, the total square meters value is computed via the following formula:
This formula considers that only a portion of the land size, typically 30%, is utilized as effective space in addition to the actual building size. This approach helps in standardizing the area being analyzed across different types of properties.
However, the calculation differs slightly for properties with different ownership types—freehold and leasehold. For leasehold properties, an adjustment factor is introduced to account for the tenure of the lease. The adjustment factor is calculated as follows:
This adjustment factor is then applied to the total square meters, giving us the total adjusted square meters (totalSqmAdjusted):
By adjusting the total square meters based on the length of the leasehold tenure relative to the median lease tenure, ensuring that the price per square meter reflects the value of the property more accurately for leasehold situations.
Finally, the price per square meter (pricePerSqm) is calculated using the adjusted square meterage:
The baseline leasehold duration is set to 25 years; the price per square meter of leaseholds with a longer duration is thus discounted and vice versa.
Calculating Regional Medians
The final step in our process is to calculate the median price per square meter for each region in Bali. This is a crucial step that transforms individual data points into a comprehensive overview, allowing users to easily compare and understand the price trends across different areas of the island.
Once the price per square meter is computed for each property, these data points are grouped by region. For each region, the median price per square meter is computed.
The median is a valuable statistic in this context because it provides a central value that is less affected by extreme outliers compared to the average. This gives a more accurate representation of typical property prices within each region.
By displaying these median prices on our interactive map, users can quickly visualize and compare property values across Bali’s various regions. Whether someone is considering an investment in a bustling area like Seminyak or a quieter locale like Ubud, they can easily see how prices vary and make more informed decisions based on current market trends.
Regional medians not only help in identifying price trends but also aid users in spotting potential investment opportunities. By providing a clear, visual representation of real estate values, Estad’s map serves as a powerful tool for anyone looking to navigate Bali’s dynamic property market.
Data Visualization
Once the data calculations are complete, the information is visualized in an interactive map that displays the median price per square meter for each region. Estad takes any effort to continuously add more relevant data to make this tool even more insightful for users making informed decisions. Additionally, Estad provides an advanced search tool to help users browse properties based on specific criteria, and offer information on how to reach out to property developers.

Leave a comment